You’ve been asked to tell a story at an event –and you say, ‘yes!’ You quickly learn the event organizers are not 100% certain what they just asked for and some of the organizers originally thought you would be reading a story from a book.
But that’s okay! It’s an opportunity to share and demonstrate the value of traditional storytelling.
In addition to the people, the place, the problem, and the progress, stories have a point! By telling a story, you’re helping convey a ‘point,’ or a meaning or message! And the event organizers most likely want to convey some point –or meaning or message –through storytelling, even if they don’t exactly know how to initially articulate it. Otherwise, they would not have requested a storyteller for the event.
So, you are now faced with the task of helping define the message –or ‘point!’ –the event organizers want to convey, and selecting the best story to help communicate that message.
If you ever find yourself in a situation like this, consider developing a matrix to identify appropriate stories for the specific event and organization, and to help organize the conversation.
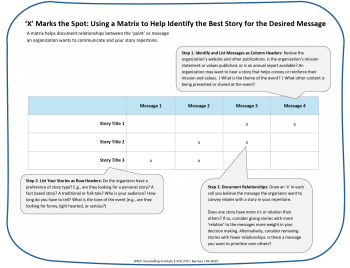
A matrix is a way to help organize and make visual relationships between two or more sets of information. But let’s not make this more complicated than it needs to be –a matrix is a chart. The chart has column and row headers, and you mark an ‘x’ where you believe there is a relation between the row and column headers.
Your Sets of Information.
In this scenario, your two sets of information are: 1. The ‘point’ or messages the organization wants to convey with a story, and 2. A list of stories you can tell (your story repertoire).
The matrix will help you identify any relationship between the ‘point’ or message the organization wants to communicate and your story repertoire. For example, if the organization wants to communicate ‘the power of creative problem solving,’ you may suggest the story, ‘Belling the Cat’ because the story includes instances where mice come up with innovative ways to outsmart a cat. In other words, the story ‘Belling the Cat’ has relation to the message of ‘the power of creative problem solving.’
Column Headers: The point or messages the organization wants to convey with a story.
If the ‘point’ or message is a bit of an unknown, this is a great place to start your conversation with the event organizers and to do your own research. To identify what point or message the organization wants to convey, consider:
- Review the organization’s website and other publications. Most organizations list their mission statement and values on their website. Many non-profit organizations publish an annual report of their activities on their website. An organization may want to hear a story that helps convey or reinforce their mission and values.
- What is the theme of the event? If the event has a specific theme, can you incorporate a story using the theme?
- Are there other presentations or speakers on the agenda? If so, are there similarities in content? Or can you gain insight to the intent of the organizers for including the other presentations and topics on the agenda? If there are similarities across topics, you may want to tag along. Or you may want to offer something completely different. Either way, this may be a good point of discussion with the organizers.
Once you develop a list of points or messages the organization may want to convey through storytelling, write each message as its own ‘column header’ in the chart.
Row Headers: A list of stories you can tell (your story repertoire).
Now that you have your column headers complete, start developing a list of stories you think relate to the messages the organization wants to convey. Write each story as its own ‘row header’ in the chart.
You have a story repertoire with existing stories –probably with multiple story types. In your discussion with the event organizers, consider asking:
- Do they have a preference of story type? E.g., are they looking for a personal story? A fact based story? A traditional or folk tale?
- Who is your audience? How long do you have to tell? What is the tone of the event (e.g., are they looking for funny, light hearted, or serious?)
Documenting Relationships: ‘X’ marks the spot!
Now that you have documented both the column and row headers, draw an ‘x’ in each cell where you believe the message the organizers want to convey relates with a story in your repertoire.
Once you have identified all the relationships, consider:
- Does one story have more x’s or relation than others? If so, consider giving stories with more ‘relation’ to the messages more weight in your decision making. Alternatively, consider removing stories with fewer relationships from your suggestions to the event organizers.
- Is there one message the organization wants to prioritize over others? If so, consider only suggesting stories that relate to at least that one priority message.
If you intend to suggest a handful of stories to the event organizers for their consideration, you can also share the completed matrix as a way for them to see your rationale for offering the selected stories during your conversation.
A matrix is a tool. You choose what tool works best for you. If ever the completely imaginary situation calls for it, I hope you find this tool and exercise helpful.
(Click on the image to see it in better detail.)
Leave a Reply